A user has the ability to create a client specific report based on monitoring programme records on the SCANNELL system.
To access the flexible report a user should follow the below steps:
1. Select ‘Reports’ from the Data module.
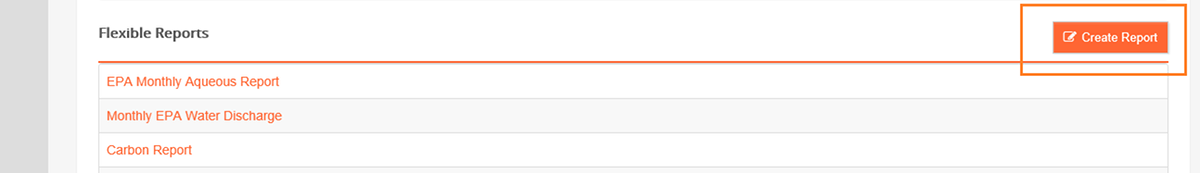
2. The ‘Reports’ page displays with a table displaying headings; Standard Reports and Flexible Reports.
3. Select ‘Create Report’ from the ‘Flexible Reports’ table.
4. The ‘Create Report (Step 1)’ page displays.
The following fields appear on the page:
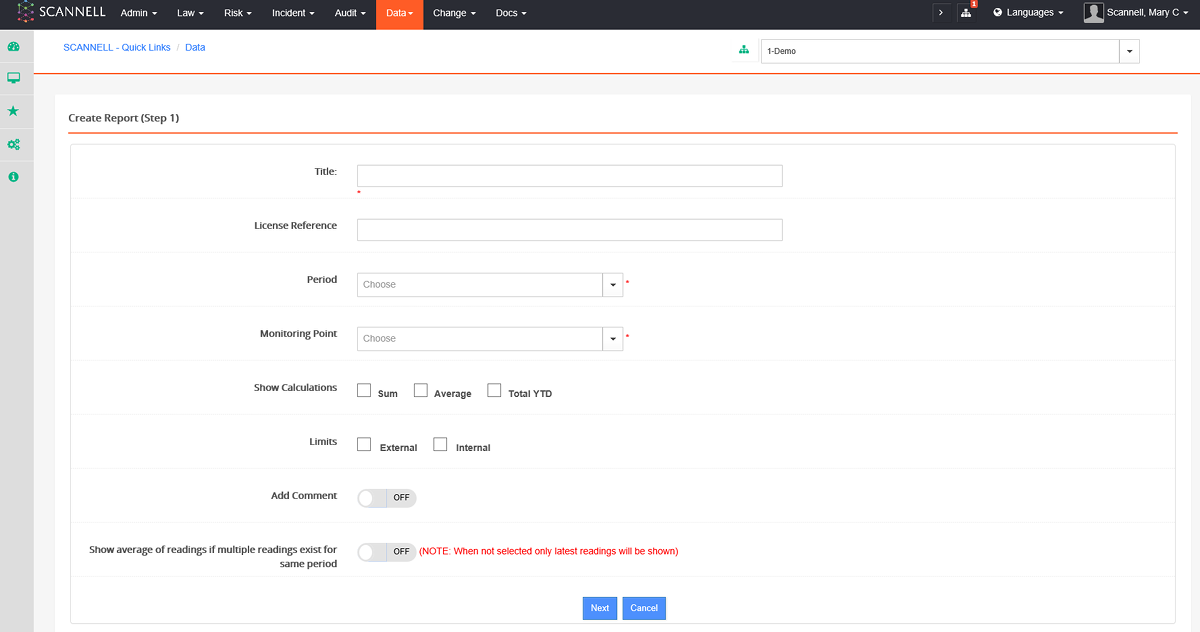
Title – Free text field to enter a title for the report.
Licence Reference – Free text field to enter a licence number.
Period – The reporting period may be Weekly (displays readings by day), Monthly (displays readings by day), or Jan-Dec (displays readings by month).
Monitoring Point – Only measurements from this measuring point will be considered in the report.
Show Calculations – Show the Sum, Average or YTD Total of the readings within the reporting period.
Limits – Show the internal or external limits set within each measurement.
Add Comment – The user can add a comment for each reporting period at the bottom of the report
Show average of readings if multiple readings exist for same period – If more than one reading is entered for the same day/month, this will show the average of the readings. If not, then the value of the latest reading will display.
When all mandatory fields are complete the user can select ‘Next’.
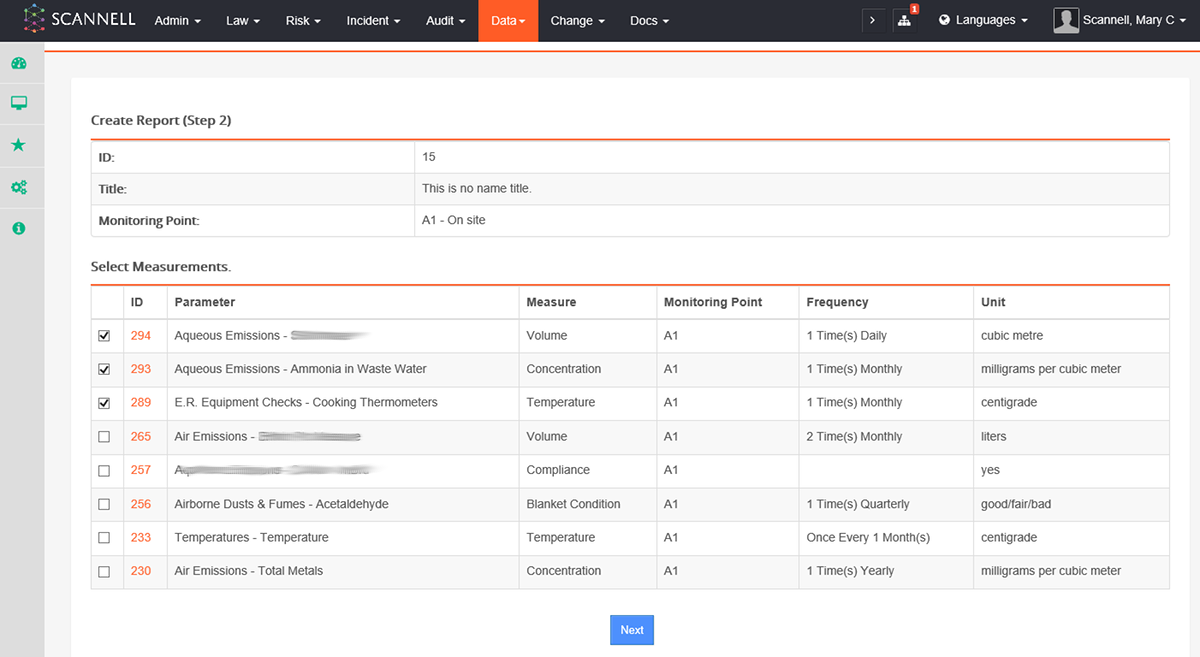
5. The ‘Create Report (Step 2)’ page displays.
Two tables appear. One with the fields:
ID – Assigned by the SCANNELL system.
Title – From ‘Create Report (Step 1).
Monitoring Point - From ‘Create Report (Step 1).
The Select Measurements table lists all measurements associated with the Monitoring Point. The user must tick a measurement to use it in the report.
After selecting the measurements, click Next.
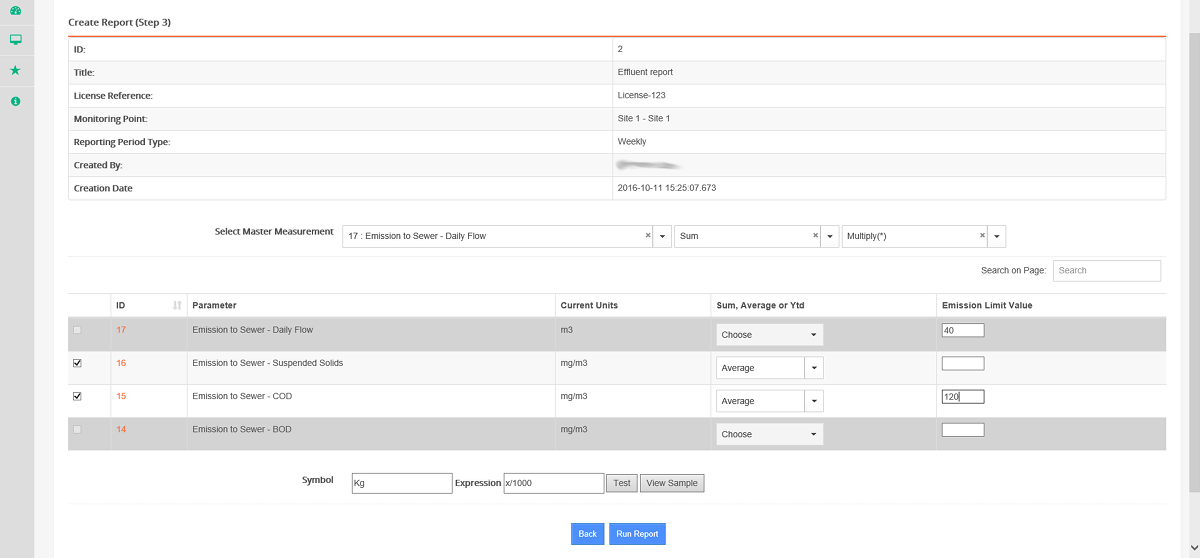
6. The ‘Create Report (Step 3)’ page displays the fields: ID, Title, License Reference, Monitoring Point, Reported Period Type, Created By, Creation Date.
Underneath the Measurements selected in ‘Create Report (Step 2)’ display.
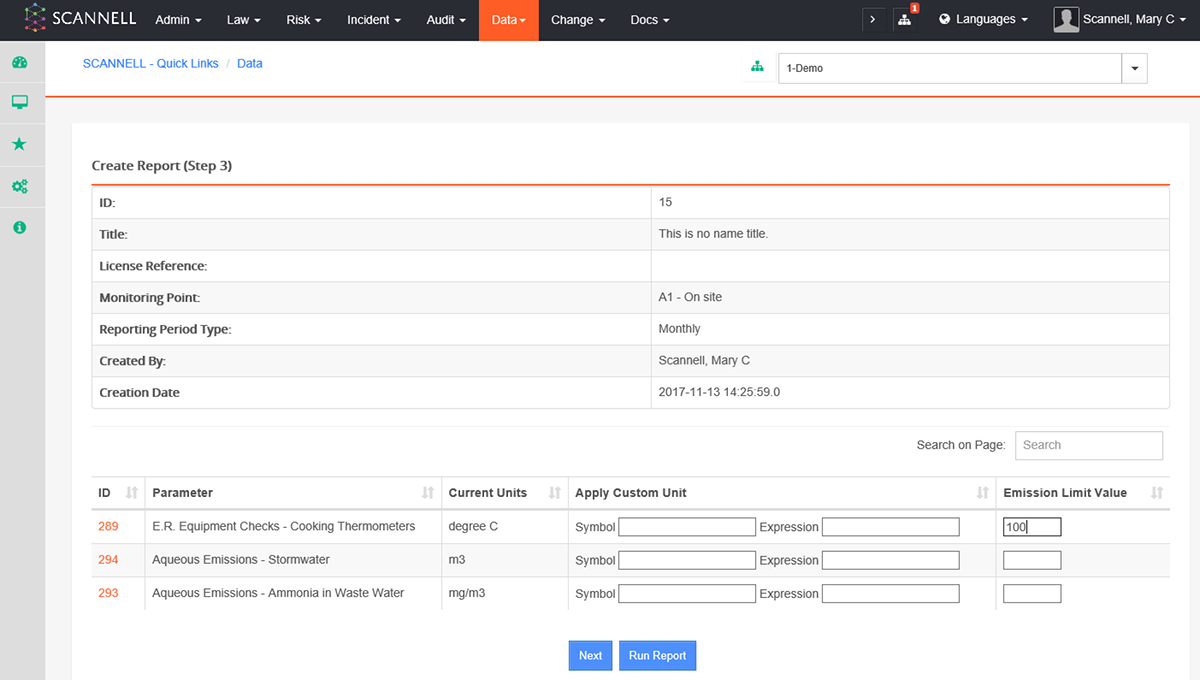
On this page you may enter an Emission Limit Value (free text field) to any measurement.
You may also apply a custom unit for Accumulative or Rate type measurements. For this, enter a symbol (free text) and a calculation expression, e.g., x*10 (the reading value is multiplied by 10 to convert it to the custom unit).
Click Run Report.
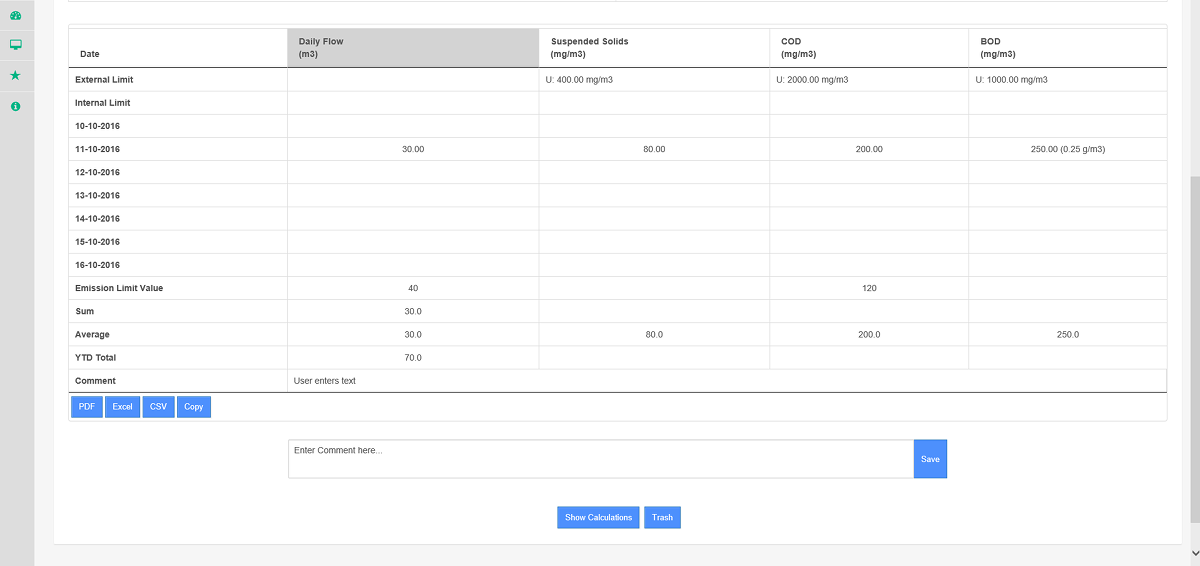
7. Report View page displays with the fields ID, Title, License Reference, Monitoring Point, Reporting Period Type, Year, Reporting Period (in this case Reporting Week), Created By and Creation Date.
The Limits, Sum, Average, YTD Total and Comment fields from ‘Create Report (Step 1)’ display, along with the Emission Limit and Custom Unit applied. The Export options PDF, Excel, CSV and Copy are listed at the end of the report.
8. To create a report which calculates the measurement readings against each other, repeat the steps above, then click Next instead of Run Report for ‘Create Report (Step 3)’.
Rate or Accumulative type measurements may be selected as Master Measurements.
Any measurements with custom units applied may not be calculated against or selected as the master measurement. They will be greyed out.
Once a measurement has been selected as the Master Measurement, it will also be greyed out. The user can then choose whether the Sum, Average or YTD Total of the Master Measurement and how to calculate this against other measurements (Add, Divide, Multiply).
The report displays. Click ‘Show Calculations’ to display the measurement calculations.
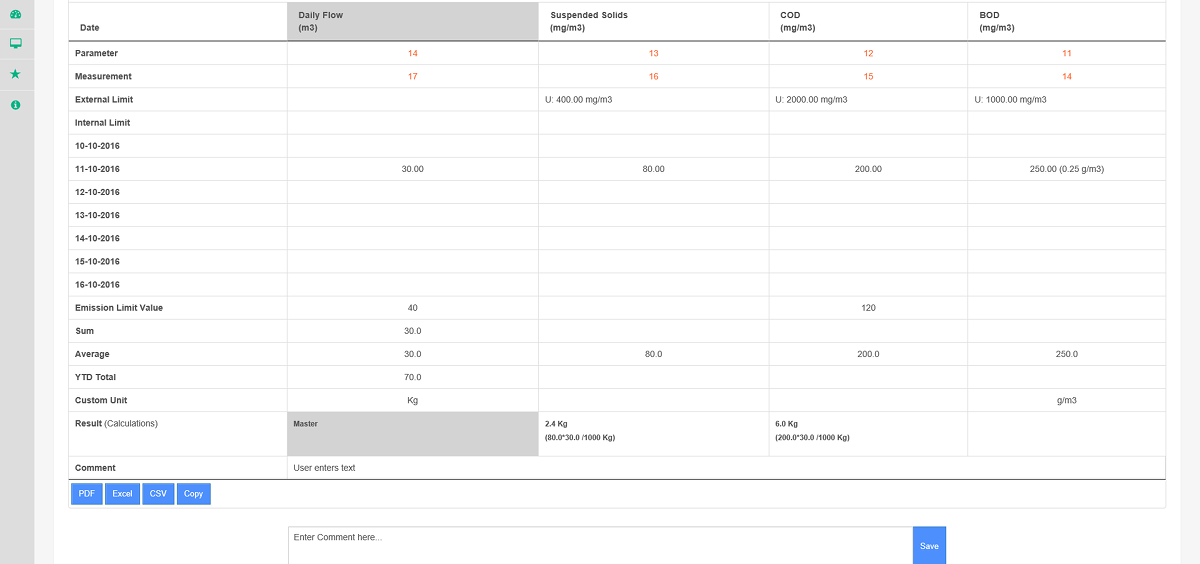
The Master Calculation will be marked in grey. The result will display in bold font with the calculation in brackets beneath it.